Edit chart
Loading graph
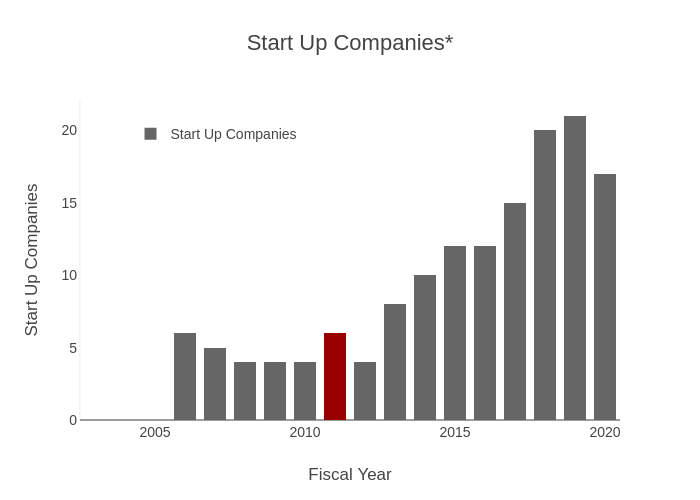
Provostncstate's interactive graph and data of "Start Up Companies*" is a stacked bar chart, showing Start Up Companies vs Baseline; with Fiscal Year in the x-axis and Start Up Companies in the y-axis.. The x-axis shows values from 2002.5 to 2020.5. The y-axis shows values from 0 to 22.105263157894736.